

Understanding the Dashboard
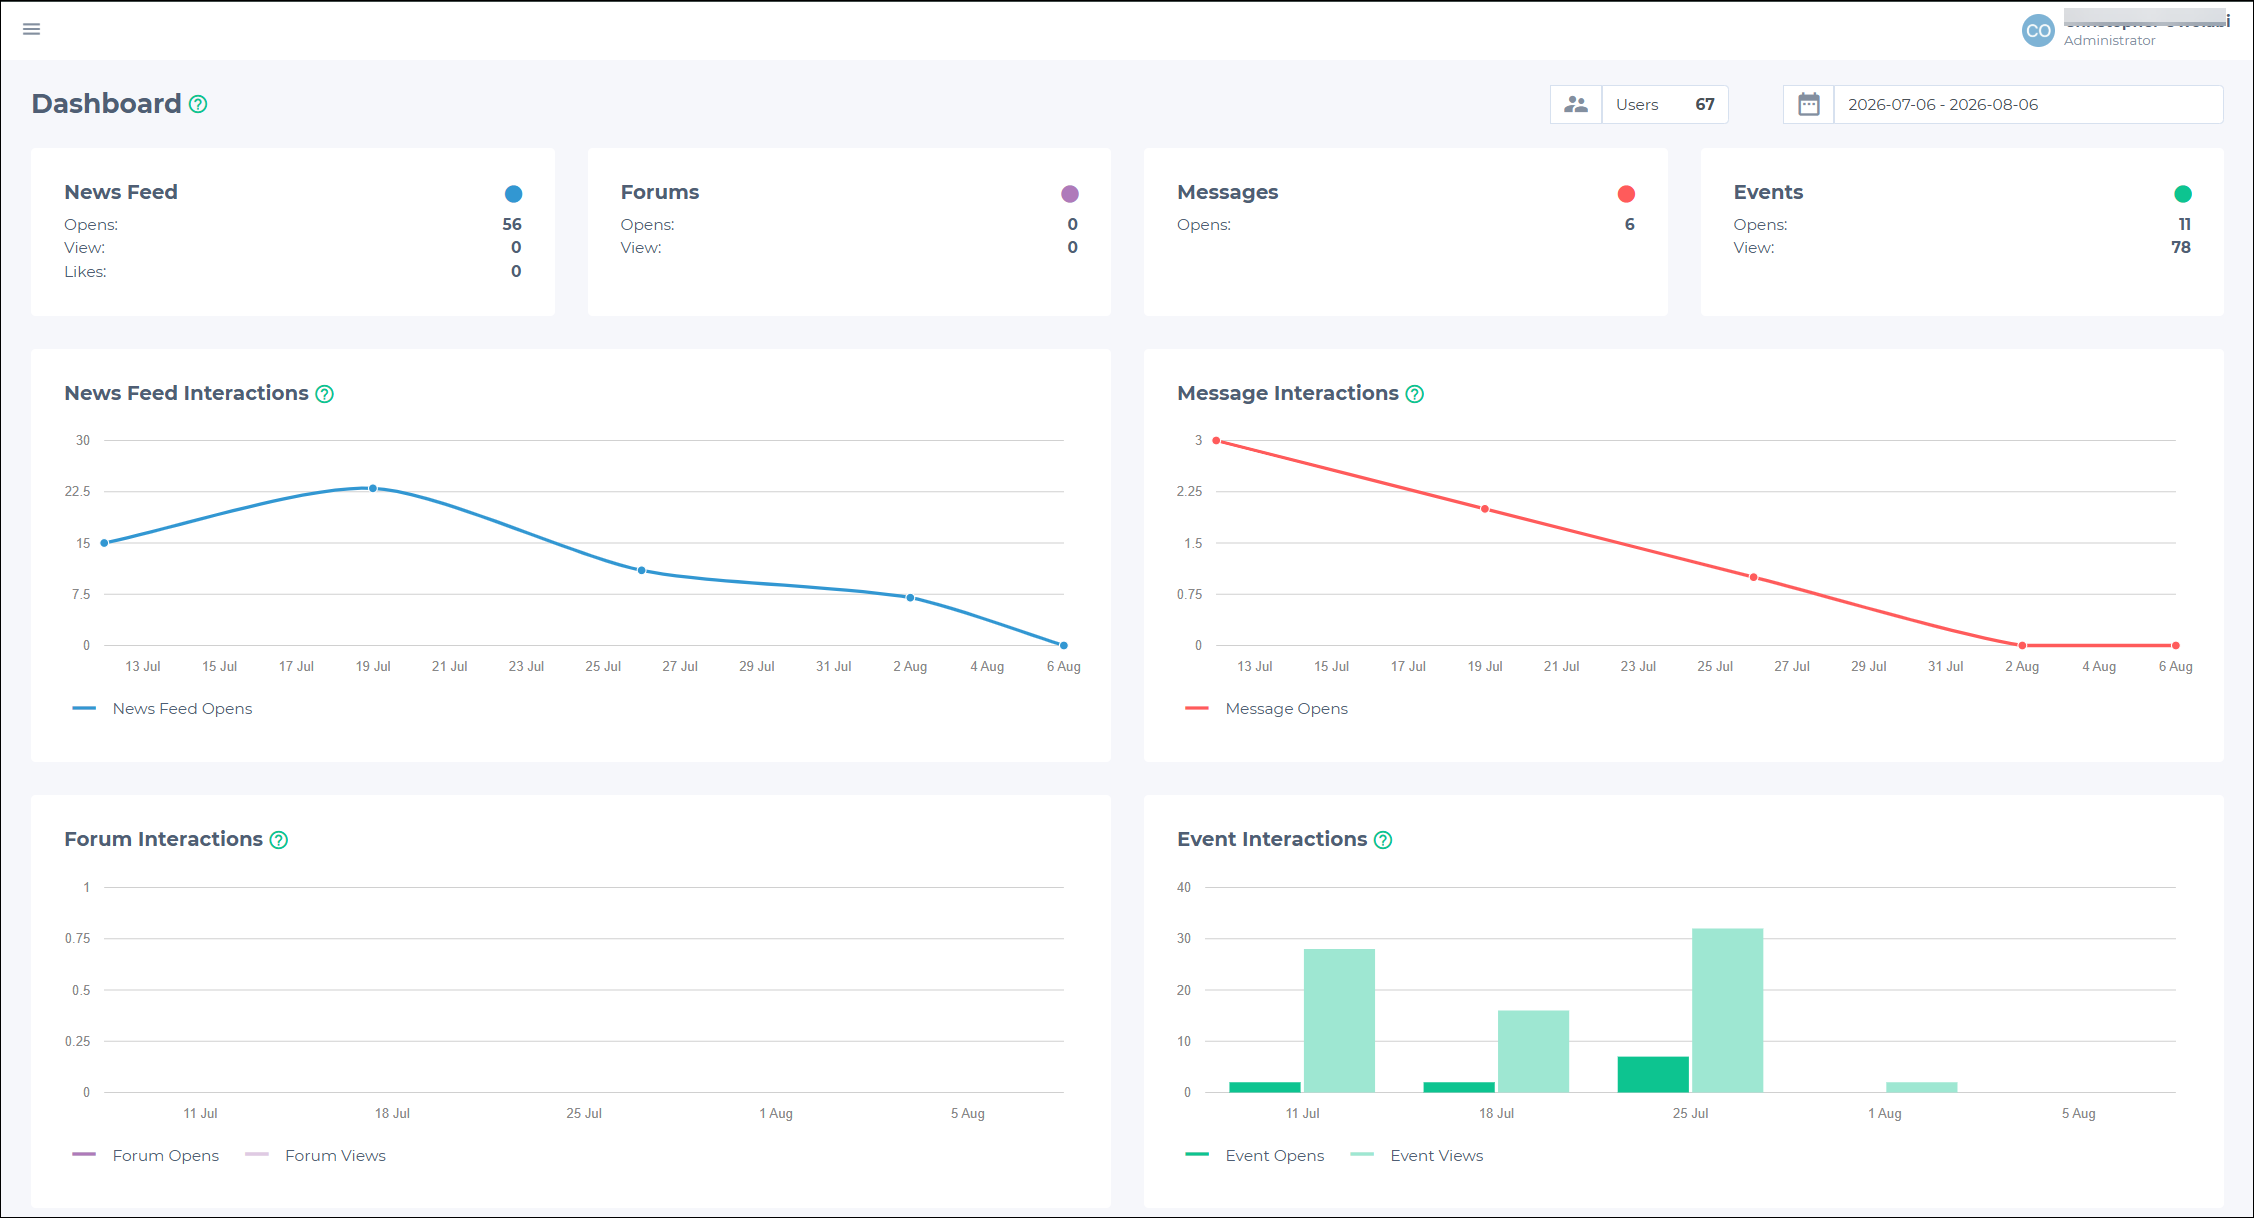
The Dashboard provides a quick summary of user activity across the app. It includes sections such as:
- News Feed
- Forums
- Messages
- Events
The dashboard sections display metrics such as:
- Opens
- Views
- Likes
Using this data, admins can track engagement and understand which areas users interact with the most.
Date range filter
At the top of the Dashboard, admins can set a date range to view statistics for a specific period. Click the calendar icon to choose from the available options:
- Preset options: Today, Yesterday, Last 7 Days, Last 30 Days, This Month, Last Month.
- Custom Range: Set a preferred start and end date.
Understanding metrics
Opens
This metric shows how many times users opened and scrolled through a section (for example, the News Feed or Events).
NOTE
Every 20 items scrolled within a section count as one open.
Refreshing the section also counts as an open.
Views
This metric counts how many times users opened a specific piece of content (for example, a post or event). Scrolling past content does not count as a view. A user must click the item to open it.
NOTEA Cron called counters-updater updates the number of views and answers for forums. The counters-updater runs daily at 4:05 am. See Cron for more information.
Likes (News Feed only)
The number of likes given to posts in the News Feed during the selected period of time.
Understanding the interaction graphs
Below the main metrics, the Dashboard shows visual graphs that track user activity over time. Each graph is focused on a specific section of the app.
News Feed Interactions
This graph shows how many times users opened the News Feed on different days. The line moves up or down depending on the number of opens. A higher point means more people opened and scrolled through the News Feed on that day.
Message Interactions
This graph shows how many messages users opened. It is useful for seeing the days on which users were more active in reading their messages.
Forum Interactions
This graph shows two things:
- Forum Opens: How many times users opened the forum section and scrolled through posts.
- Forum Views: How many times users clicked to read a specific post.
These numbers are updated once a day by Cron.
Event Interactions
This graph also shows two things:
- Event Opens: How many times users opened the event list and scrolled through it.
- Event Views: How many times users clicked to open a specific event.
Updated 3 months ago