

Creating a Dashboard with Report Writer PLUS
NoteDashboard reports cannot be added as attachments in communications such as emails.
When a Dashboard is run, it is displayed in a new tab called the Dashboard Viewer. Reports, Visualizations, and other dashboard content appear in rectangular Tiles on the Canvas.
Do the following to create a new dashboard:
- Click Create New Report and select Dashboard. This opens a New Dashboard canvas.
- The Canvas Fit (right) determines how much of the dashboard a new tile will occupy. You can manually resize the tile once you add it to the canvas.
- You can also define Backgrounds and Borders for the new tile.
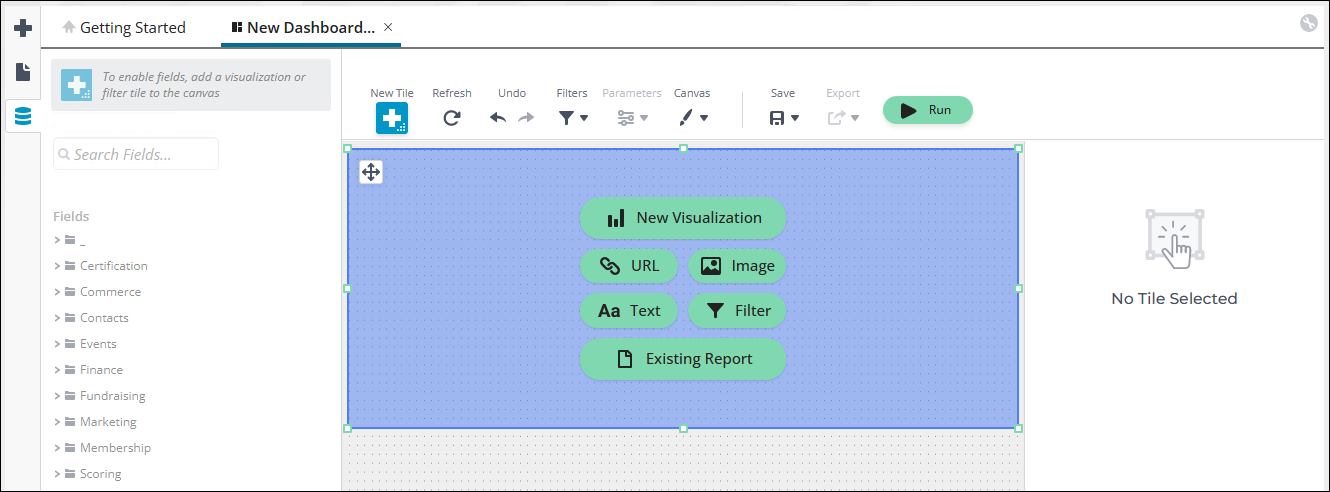
- Drag-and-drop New Tile onto the canvas.
-
You can add the following to the new tile:
-
New Visualization
-
URL
-
Image
NoteCurrently, images are not displayed when a report is run.
- Text
- Filter
- Existing Report
-
For example, add an existing report:
- Click Existing Report.
- Drag-and-drop the report from the Reports pane onto the canvas.
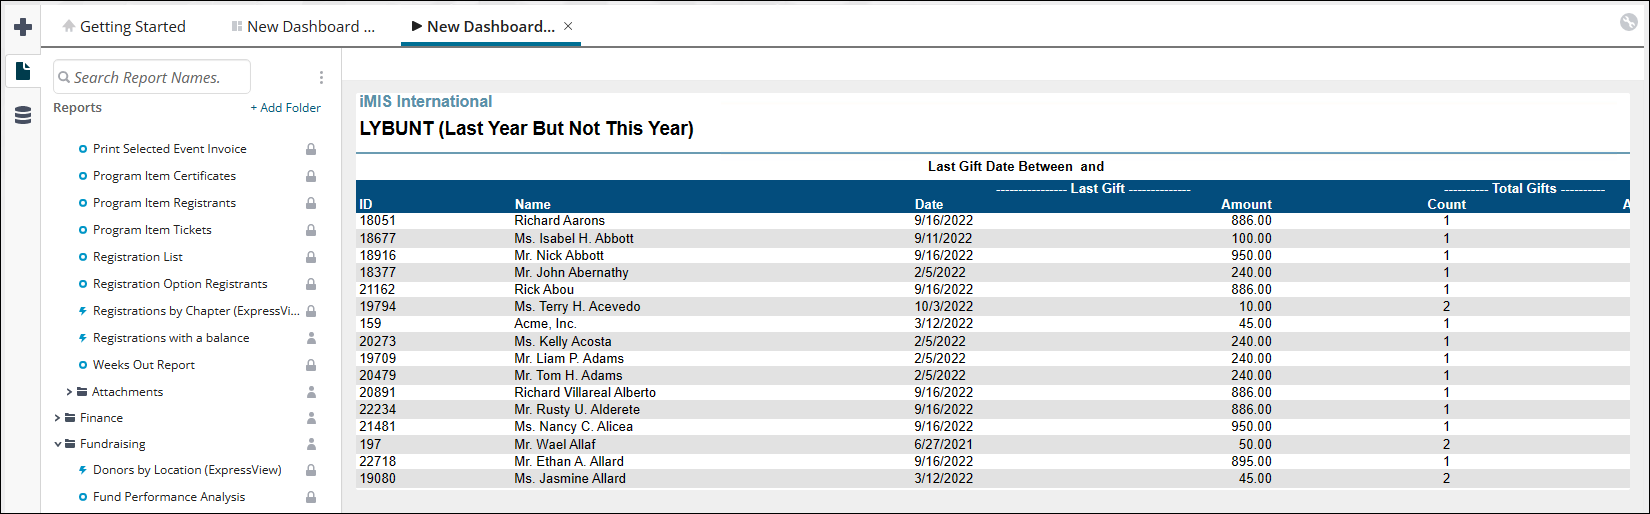
Now add a New Visualization:
- Drag-and-drop a New Tile onto the canvas.
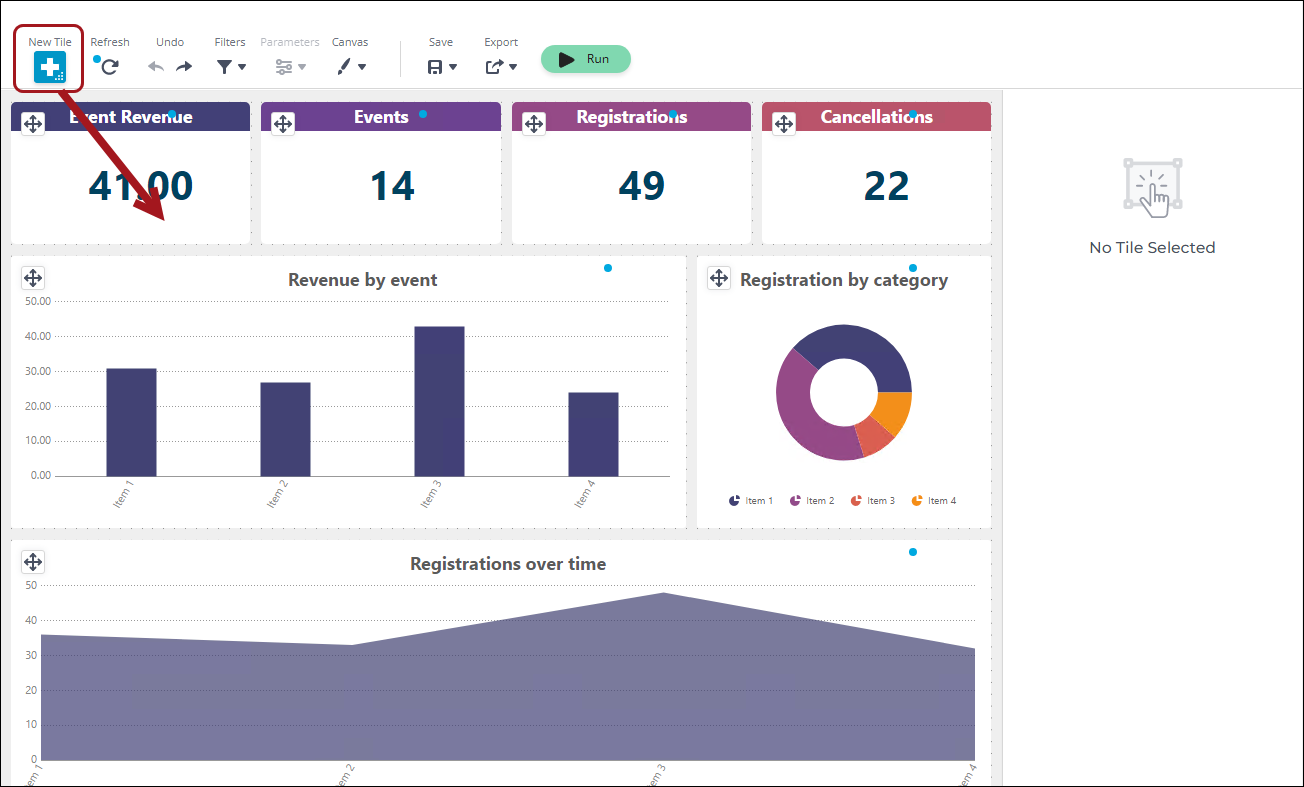 2. Click New Visualization.
 - Define the visualization in the right pane:
- The type of chart used to display data
- Labels on the chart
- Styling for the chart
- Drag-and-drop items for the visualization Groups and Values from the Fields pane.
- Edit the style of the visualization on the right-side property pane.
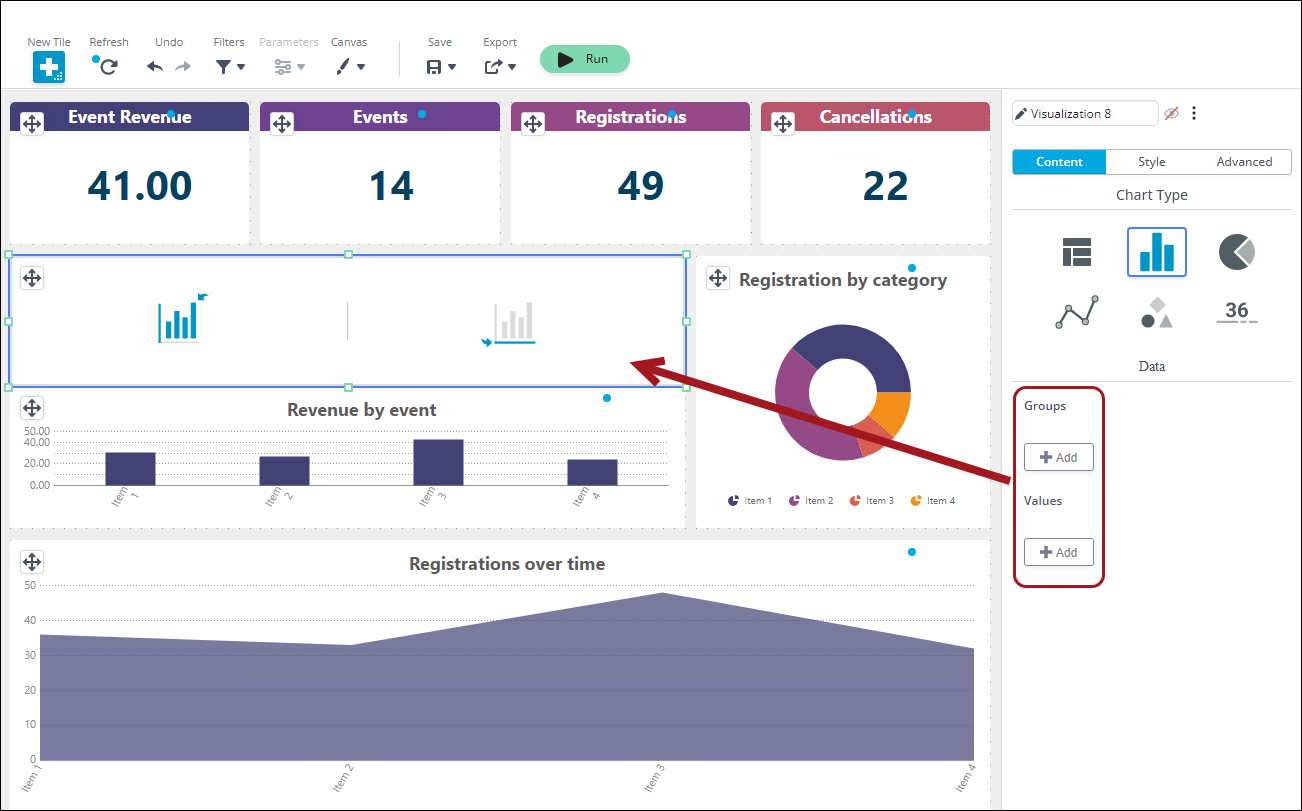
- Edit the style of the visualization on the right-side property pane.
You can add a Filter to help modify displayed information:
- Drag-and-drop a New Tile onto the canvas.
- Click Filter. You can also create a docked filter.
- Select the field on which you want to filter. Define an Operator for the filter.
-
Use the following to further update your dashboard:
- Refresh the data in real time
- Undo/redo changes to your dashboard
- Filter information
- Change Parameters
- Customize the Canvas
- Save your dashboard
- Export your dashboard
- Run your dashboard

For more information, see Dashboards documentation.
Updated 5 months ago
Did this page help you?