

iMIS Dashboards Overview
There are many out-of-the-box dashboards available to staff users in the Staff site. These dashboards display summary information through the use of many IQA queries.
These dashboards can be modified so that you can tailor them to your organizational needs. To learn how to tailor the dashboards, see Modifying out-of-the-box dashboards.
NoteIn order for the dashboards to have an appropriate loading time, some queries will need to be cached. Caching a query saves the initial results, and then periodically refreshes the query when the page is reloaded. To enable query caching, enable Use cached results from the query Summary tab.
Community dashboard
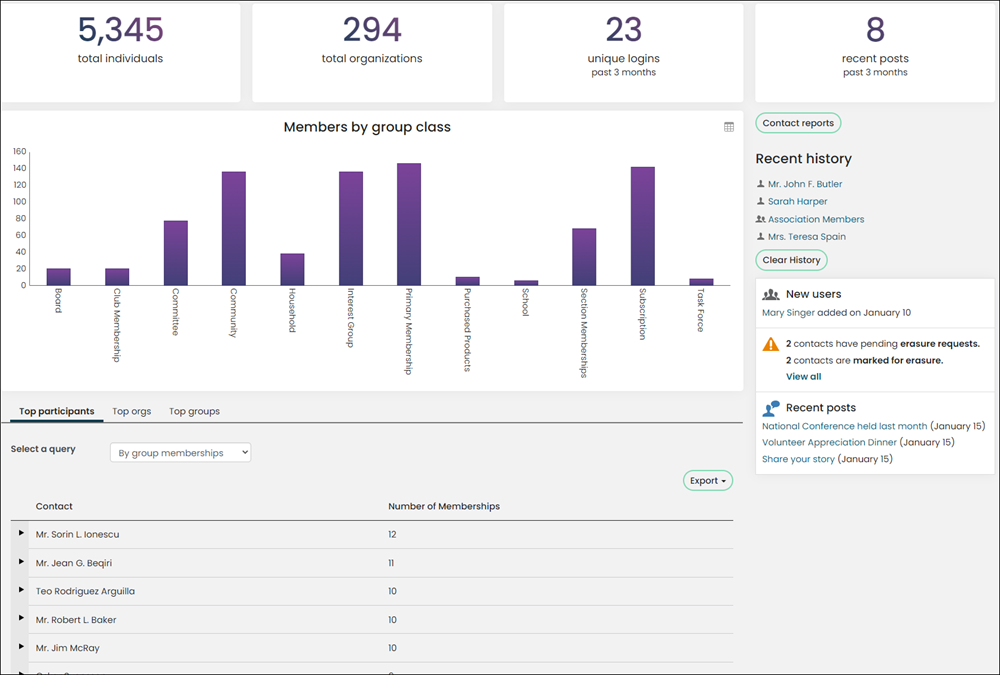
The following information can be found in the Community dashboard:
- Number of Individuals
- Number of Organizations
- Number of unique logins in the past 3 months
- Number of community posts in the past 3 months
- Number of members by group class
- Top Participants ranked by amount of group memberships or community posts
- Top Organizations ranked by individual group memberships, organization group memberships, or individual posts.
- Several community related alerts
Data integrity dashboard
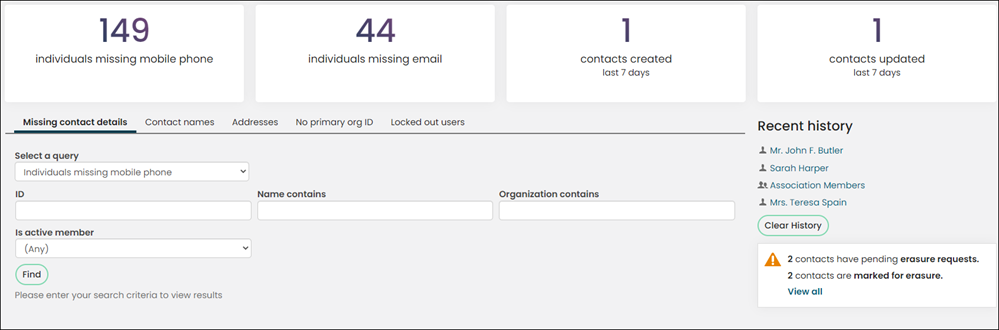
The following information can be found in the Data integrity dashboard:
- Number of individuals missing a mobile phone number
- Number of individuals missing an email address
- Number of new contacts within the last seven days
- Number of updated contacts within the last seven days
-
Missing contact details tab:
- List of specific individuals who are missing their mobile phone or email
- List of organization missing their email
-
Contact names tab:
- Individuals with a non-alpha characters in their first, informal, last ,middle or organization name fields
- Individuals who are missing a full name
- Organizations with non-alpha characters in their name
-
Addresses tab:
- Addresses with invalid country names
- Addresses missing a country
- Individuals and organizations missing a preferred billing, mailing, or shipping address
- No primary org ID tab displays a list of individuals with a text value for primary organization, but no party ID
- Locked out users tab displays a list of users who are locked out
Club Attendance dashboard
📘 Note
You must be licensed for Clubs to have a club-related functionality. Contact ASI for more information.
The data on this dashboard only applies to the selected club and the members whose primary club matches the selected club.
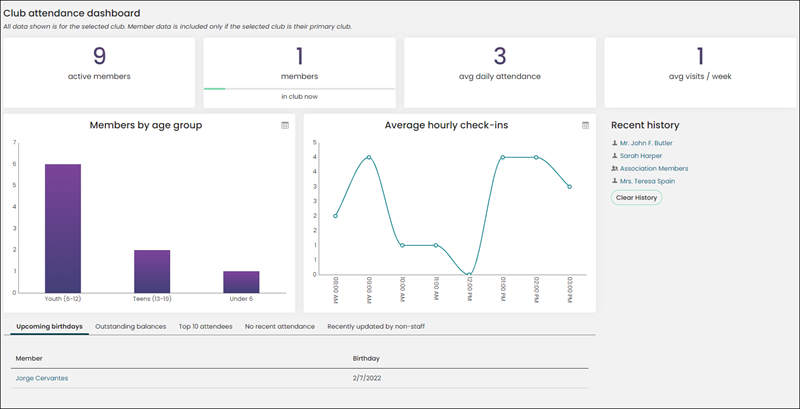
The following information can be found on the Club attendance dashboard in the Club Staff site:
- Number of active members checked in
- Number of members currently in the club
- Average daily attendance
- Average visits per week
- Number of members by age group
- Number of average hourly check-ins
- Data integrity:
- Upcoming birthdays
- Outstanding balances
- Top 10 attendees
- No recent attendance
- Recently updated by non-staff
📘 Note
To update the content that displays on this dashboard, copy the out-of-the-box content and update the associated shortcut. The shortcut associated with this navigation item, Club Staff site > Dashboard, is ClubStaffDashboard. See Managing shortcuts for more information.
Club programs attendance dashboard
📘 Note
You must be licensed for Clubs to have a club-related functionality. Contact ASI for more information.
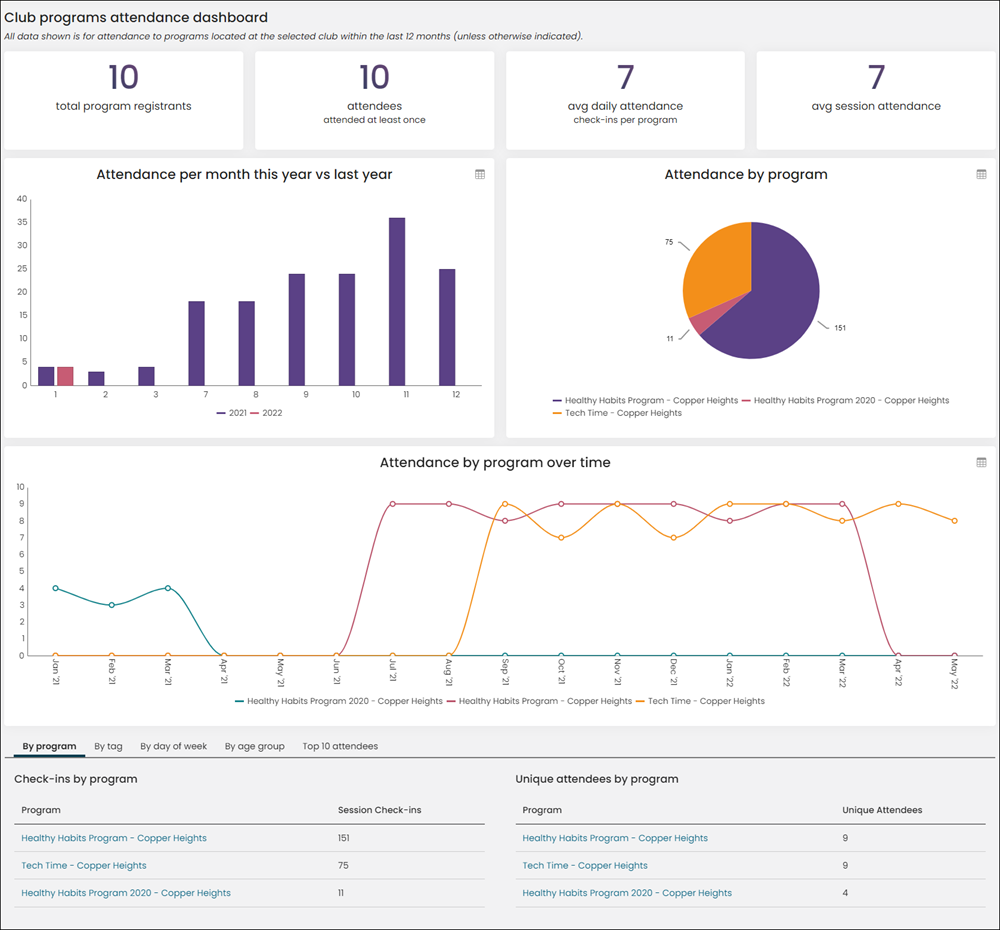
From the Club Staff site, go to Programs > Dashboard. The Club Program Attendance dashboard includes data for programs occurring in the currently selected club over a 12-month period.
📘 Note
To customize the dashboard, create a shortcut that points to out-of-the-box content ClubStaffProgramDashboard. SeeManaging websites for more information.
Understanding the progress trackers

The progress trackers display the following information:
- Program registrants - The number of active registrants for any event with a category of Program, located at the selected club, where the event start date is within 12 months OR the event end date is within 12 months. A person registered for two or more programs will only be counted once.
- Attendees - The number of unique contacts who have attended at least one session in the past 12 months for an event with a category of Program that is located at the selected club. A person who attended more than one program will only be counted once.
- Average daily attendance - The average number of check-ins in one day to one program for the selected club in the past 12 months.
- Average session attendance - The average number of check-ins for sessions located in the selected club in the past 12 months.
Understanding the charts
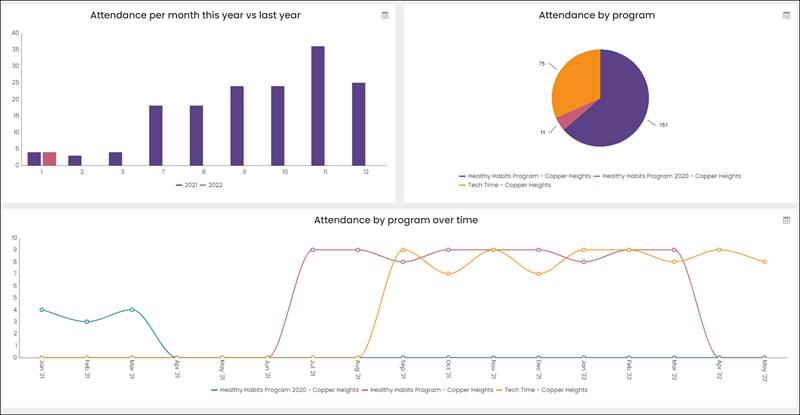
You can view the following kinds of attendance charts:
- Bar (multi-series)- Current year vs Last year (by month or last 2 years)
- Pie - Over time by program (by month or last 12 months)
- Line (multi-series)- - Attendance by program (last 12 months)
Understanding the queries

The following queries provide data for the number of check-ins and number of unique check-ins in each:
- By program
- By tag
- By day of week
- By age group
- Top 10 attendees
Program Attendance dashboard
📘 Note
You must be licensed for Clubs to have a club-related functionality. Contact ASI for more information.
From the Club Staff site, go to Events > Program attendance. The Club Program Attendance dashboard includes data for programs over a 12-month period.
📘 Note
To customize the dashboard, create a shortcut that points to out-of-the-box content ProgramAttendanceDashboard. See Managing websites for more information.
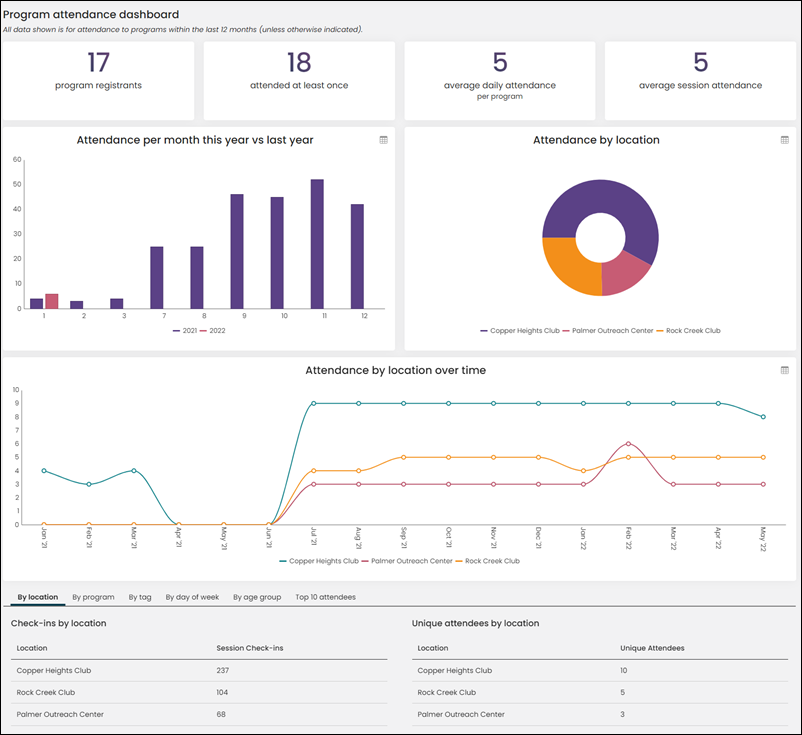
Understanding the progress trackers

The progress trackers display the following information:
- Program registrants - The number of active registrants for any event with a category of Program, where the event start date is within 12 months OR the event end date is within 12 months. A person registered for two or more programs will only be counted once.
- Attendees - The number of unique contacts who have attended at least one session in the past 12 months for an event with a category of Program. A person who attended more than one program will only be counted once.
- Average daily attendance - The average number of check-ins in one day to one program for the selected club in the past 12 months.
- Average session attendance - The average number of check-ins for sessions located in the selected club in the past 12 months.
Understanding the charts
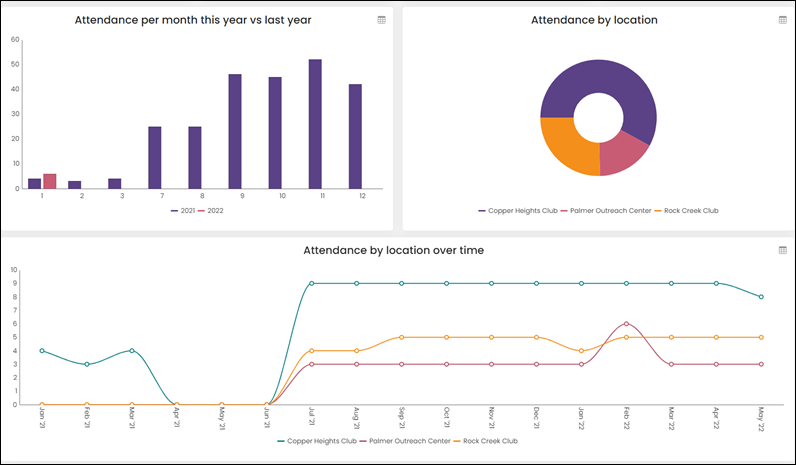
You can view the following kinds of attendance charts:
- Bar (multi-series)- Current year vs Last year (by month or last 2 years)
- Pie - Over time by program (by month or last 12 months)
- Line (multi-series)- - Attendance by program (last 12 months)
Understanding the queries

The following queries provide data for the number of check-ins and number of unique check-ins in each:
- By location
- By program
- By tag
- By day of week
- By age group
- Top 10 attendees
Event Attendance dashboard
From the Club Staff site, go to Events > Event attendance. This dashboard details attendance for all events, including those in the programs
📘 Note
To customize the dashboard, create a shortcut that points to out-of-the-box content StaffEventAttendanceDashboard. See Managing websites for more information.
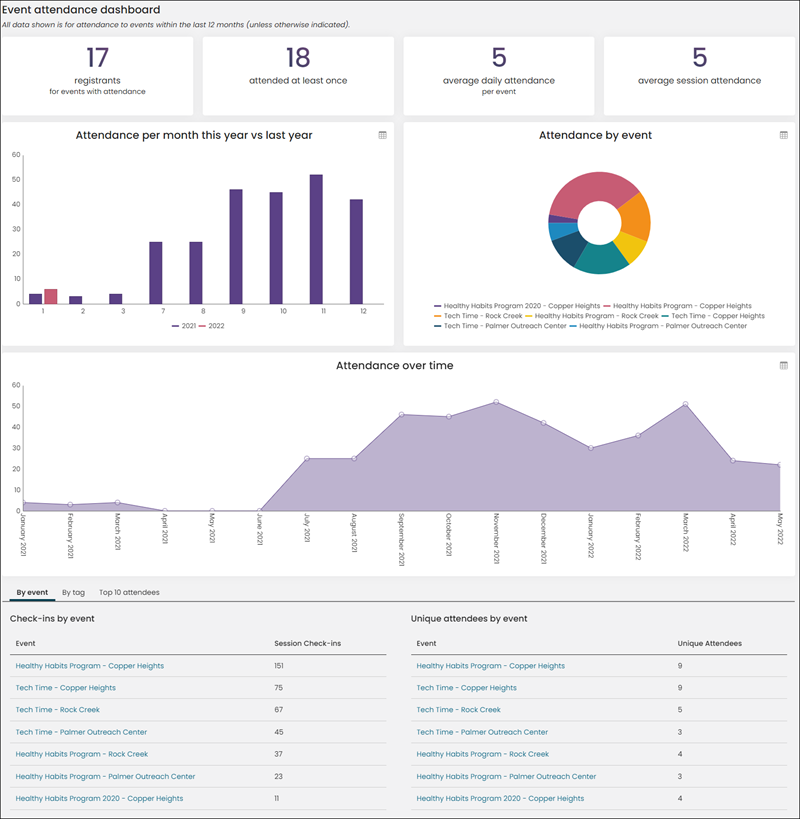
Understanding the progress trackers

The progress trackers display the following information:
- Event registrants - The number of active registrants for any event where the event start date is within 12 months OR the event end date is within 12 months. A person registered for two or more programs will only be counted once.
- Attendees - The number of unique contacts who have attended at least one event in the past 12 months. A person who attended more than one event is counted only once.
- Average daily attendance - The average number of check-ins in one day to an event in the past 12 months.
- Average session attendance - The average number of check-ins for events in the past 12 months.
Understanding the charts
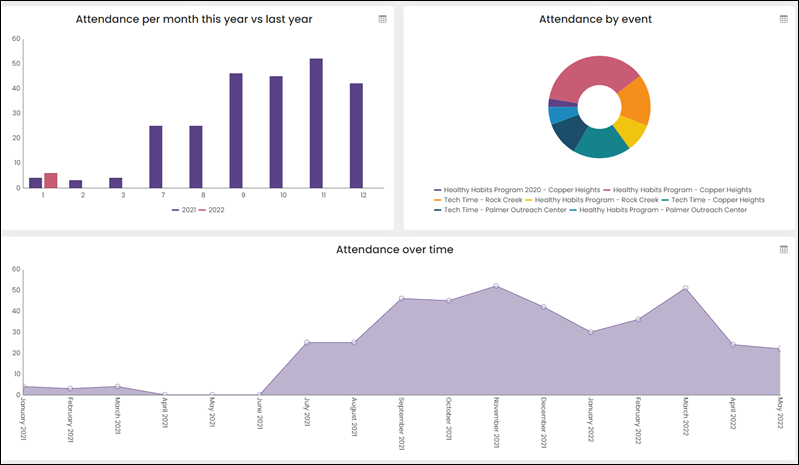
You can view the following kinds of attendance charts:
- Bar (multi-series)- Current year vs Last year (by month or last 2 years)
- Pie - Over time by program (by month or last 12 months)
- Line (multi-series)- - Attendance by program (last 12 months)
Understanding the queries
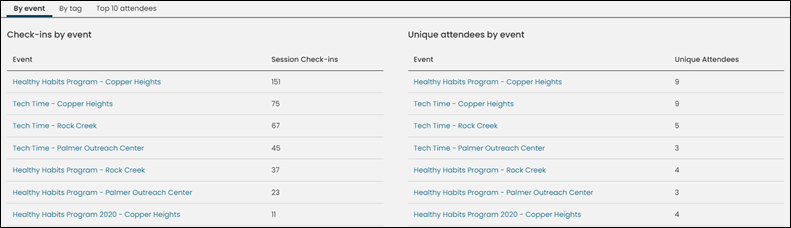
The following queries provide data for the number of check-ins and number of unique check-ins in each:
- By event
- By tag
- Top 10 attendees
Engagement dashboard
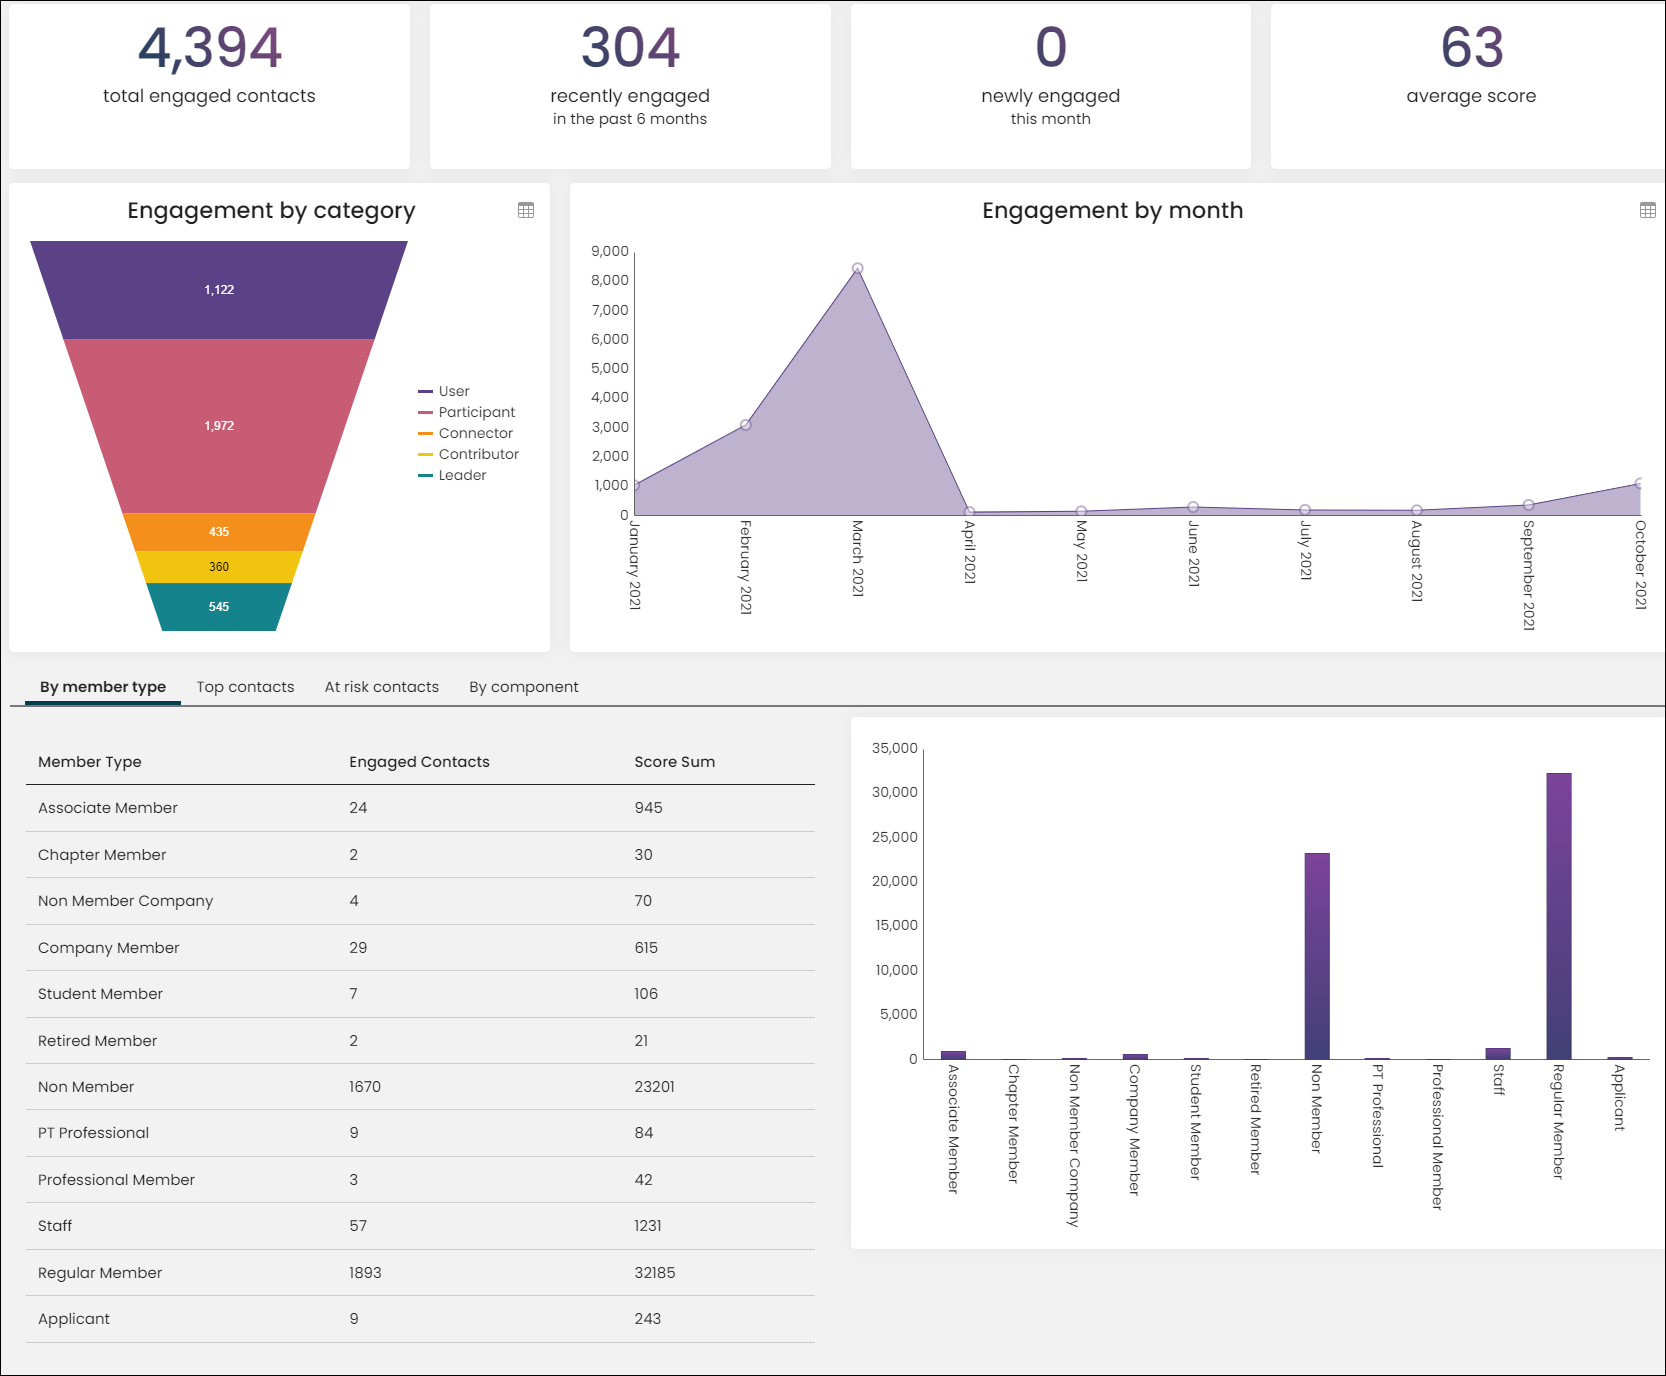
The following information can be found in the Engagement dashboard:
- Total engaged contacts versus total contacts
- Recently engaged contacts (within 6 months)
- Newly engaged contacts this month
- Average score
- Engagement by category (funnel chart)
- Engagement by month (area chart)
- Score sum by member type (bar chart)
- Top contacts (individuals, organizations and organizations by individual engagement
- High engagement score contacts not recently engaged (within six months)
- Scores by component (pie chart)
Membership dashboard
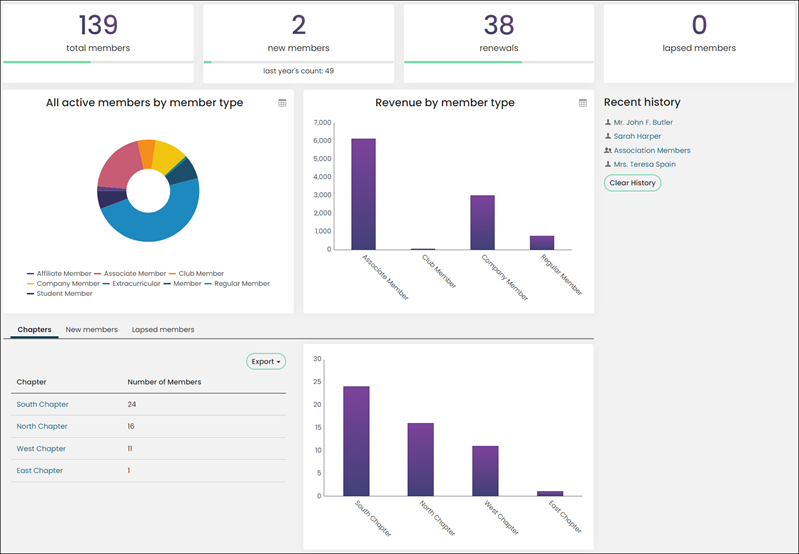
The following information can be found in the Membership dashboard:
- Number of members
- Number of new members and comparison to last year
- Number of renewed members for the year
- Number of lapsed members
- Number of active members by member type
- Amount of revenue by member type
- Number of members by chapter
- List of new members
- List of lapsed members
- Display of recent history
- Several membership related alerts
Chapter dashboard
From the Staff site, go to Membership > Chapters, and select a chapter to open a chapter-specific dashboard.
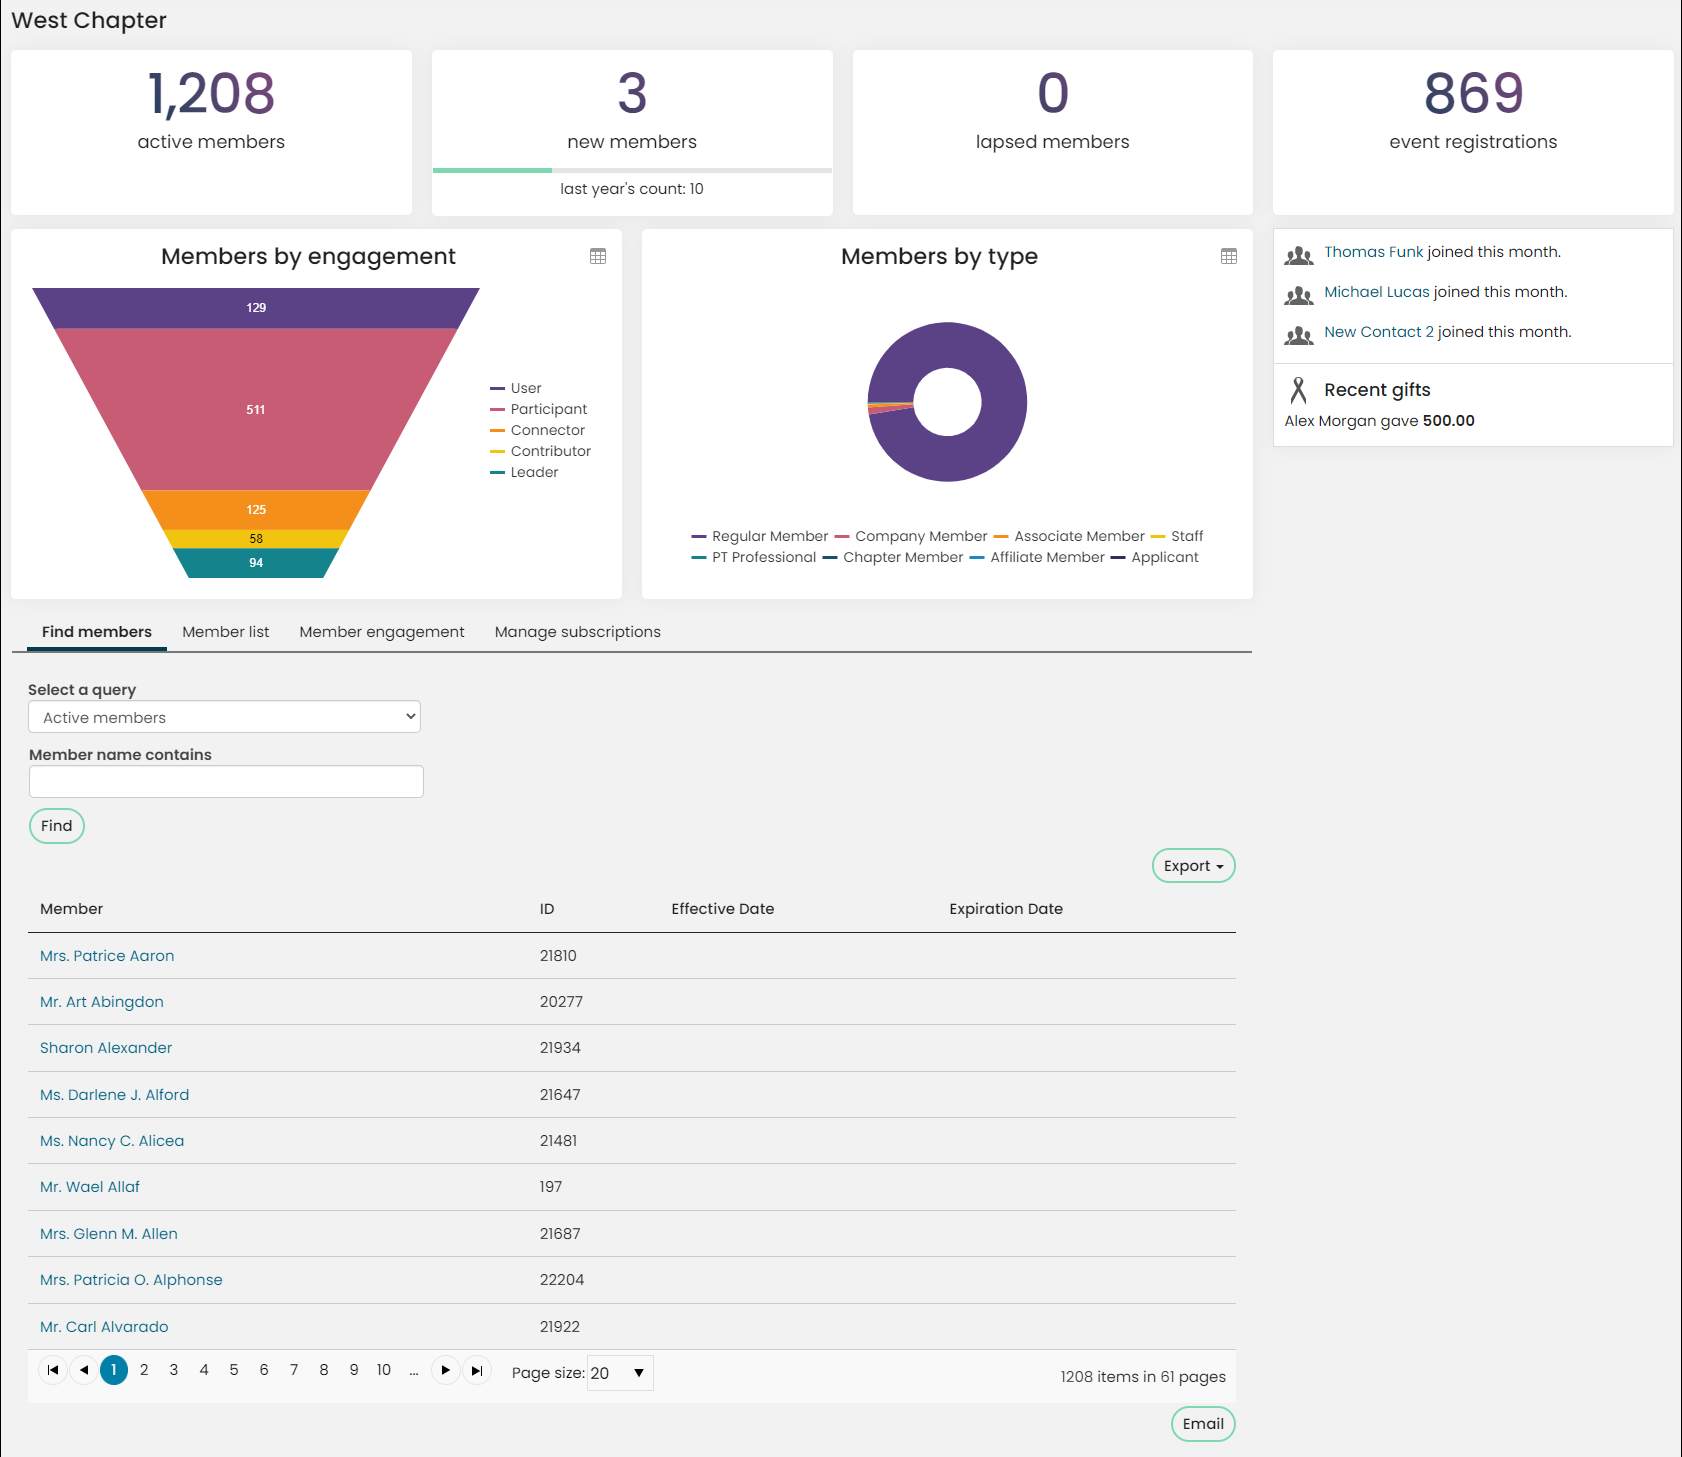
The chapter-specific dashboard provides counter tiles, charts, queries and alerts related to members of the selected chapter. The chapter dashboard is available to Chapter Administrators of the selected chapter as well as staff users.
The following information can be found in the chapter dashboard:
- Total number of active, new, and lapsed members.
- Total number of event registrations for members of the chapter.
- Total number of chapter members in each engagement category for the default out-of-the-box Engagement score. See Scoring for more information.
- Total number of chapter members by member type.
- Several membership related alerts to chapter member activity.
Several actions can be taken from the chapter dashboard, including the following:
- Manage subscriptions (Staff users only).
- Modify chapter membership details and add new members.
📘 Note
To manage membership details, go to Settings > Membership, and enable either the Allow staff to manage chapter memberships directly from member list option or the Allow chapter administrators to manage chapter memberships directly from member list option.

To customize the chapter dashboard, make a copy of the out-of-the-box content, and update the ChapterDetailAdmin shortcut to point to your new copy.
Organization attendance dashboard
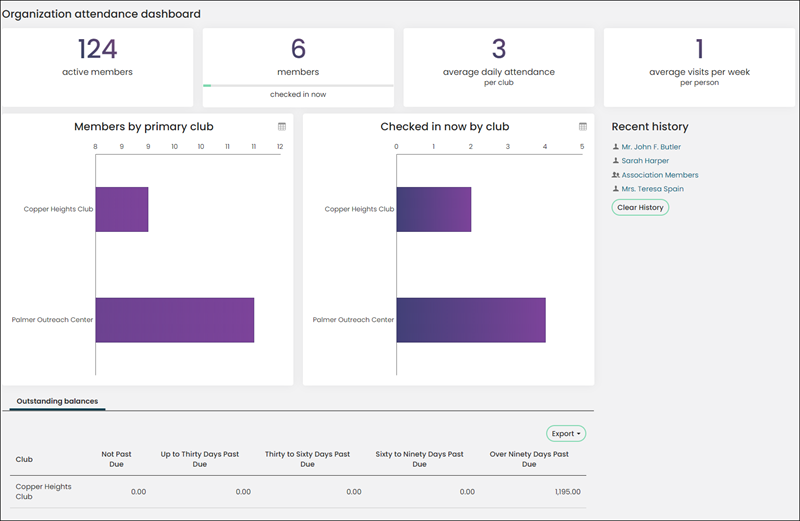
This dashboard is licensed to clubs. To make changes to the dashboard content, make a copy of the out-of-the-box content record and update the AttendanceDashboard shortcut.
The following information can be found in the Organization attendance dashboard:
- Number of active members
- Number of members checked in
- Average daily attendance
- Average visits per week
- Members by primary club
- Members checked in by club
- Outstanding balances for the club
AutoPay Membership dashboardPLUS
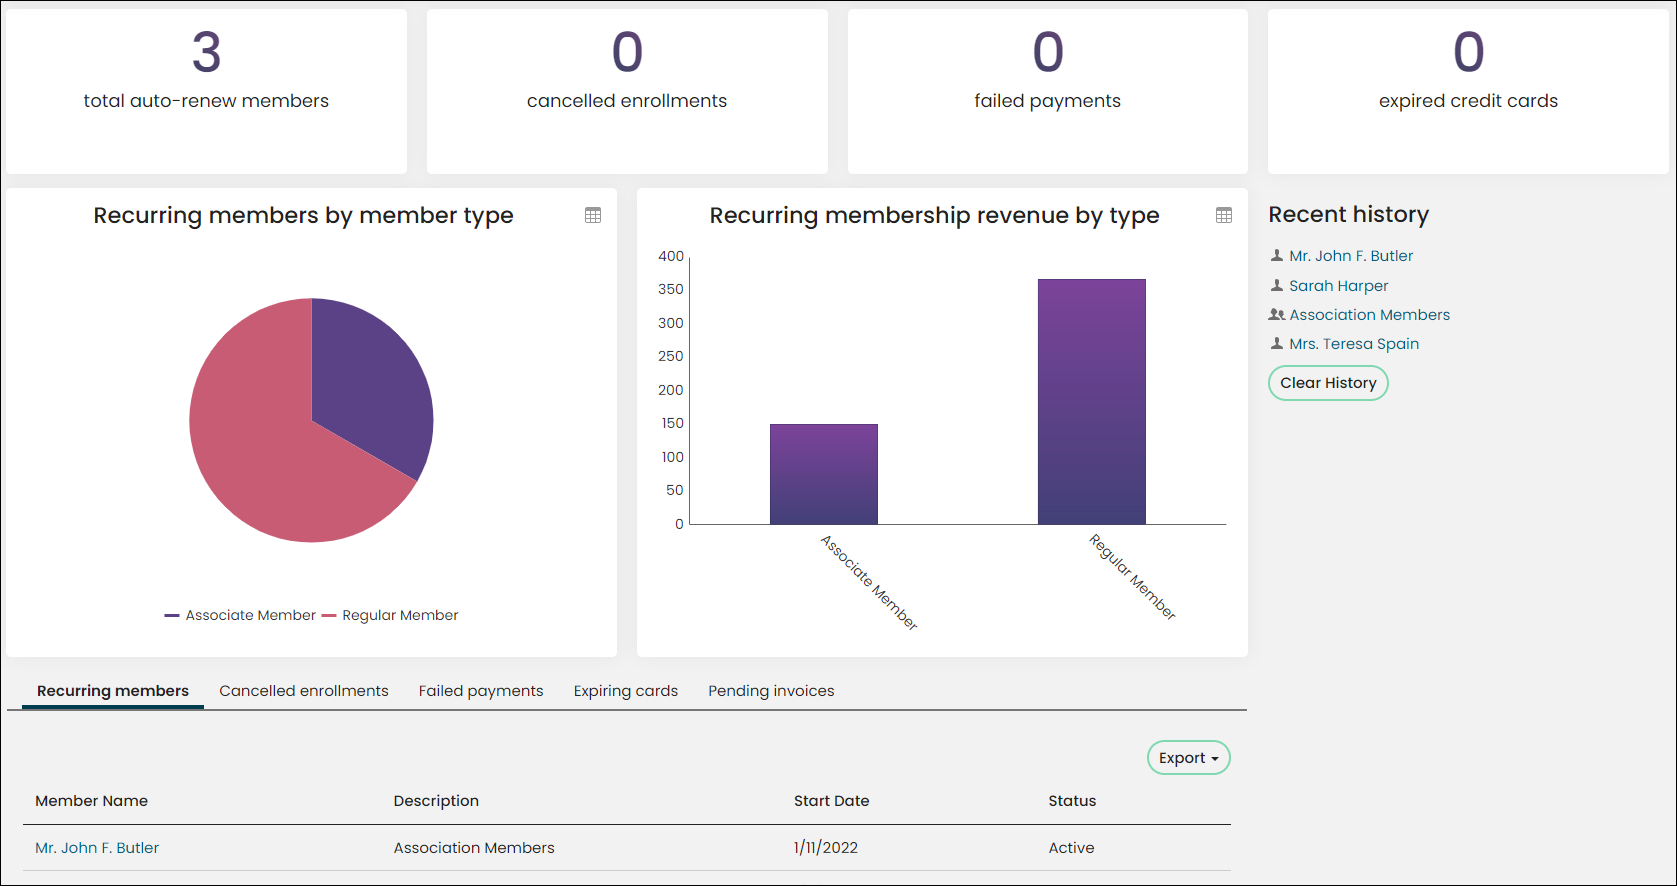
The following information can be found in the AutoPay Membership dashboard:
- Recurring members
- Cancelled enrollments
- Failed payments
- Expired credit cards
- Recurring members by member type (pie chart)
- Recurring membership revenue by member type (bar chart)
- A list of recurring members including member name, membership description, start date, and status
- A list of cancelled enrollments including member name, membership description, enrollment start date, the date the enrollment was cancelled, and the cancellation reason
- A list of failed payments including member name, invoice date, invoice number, balance, the payment details, the result and details
- A list of expiring cards including member name, the date the card expires, the credit card summary, and description
- A list of pending invoices related to expired credit card payments
Fundraising dashboard
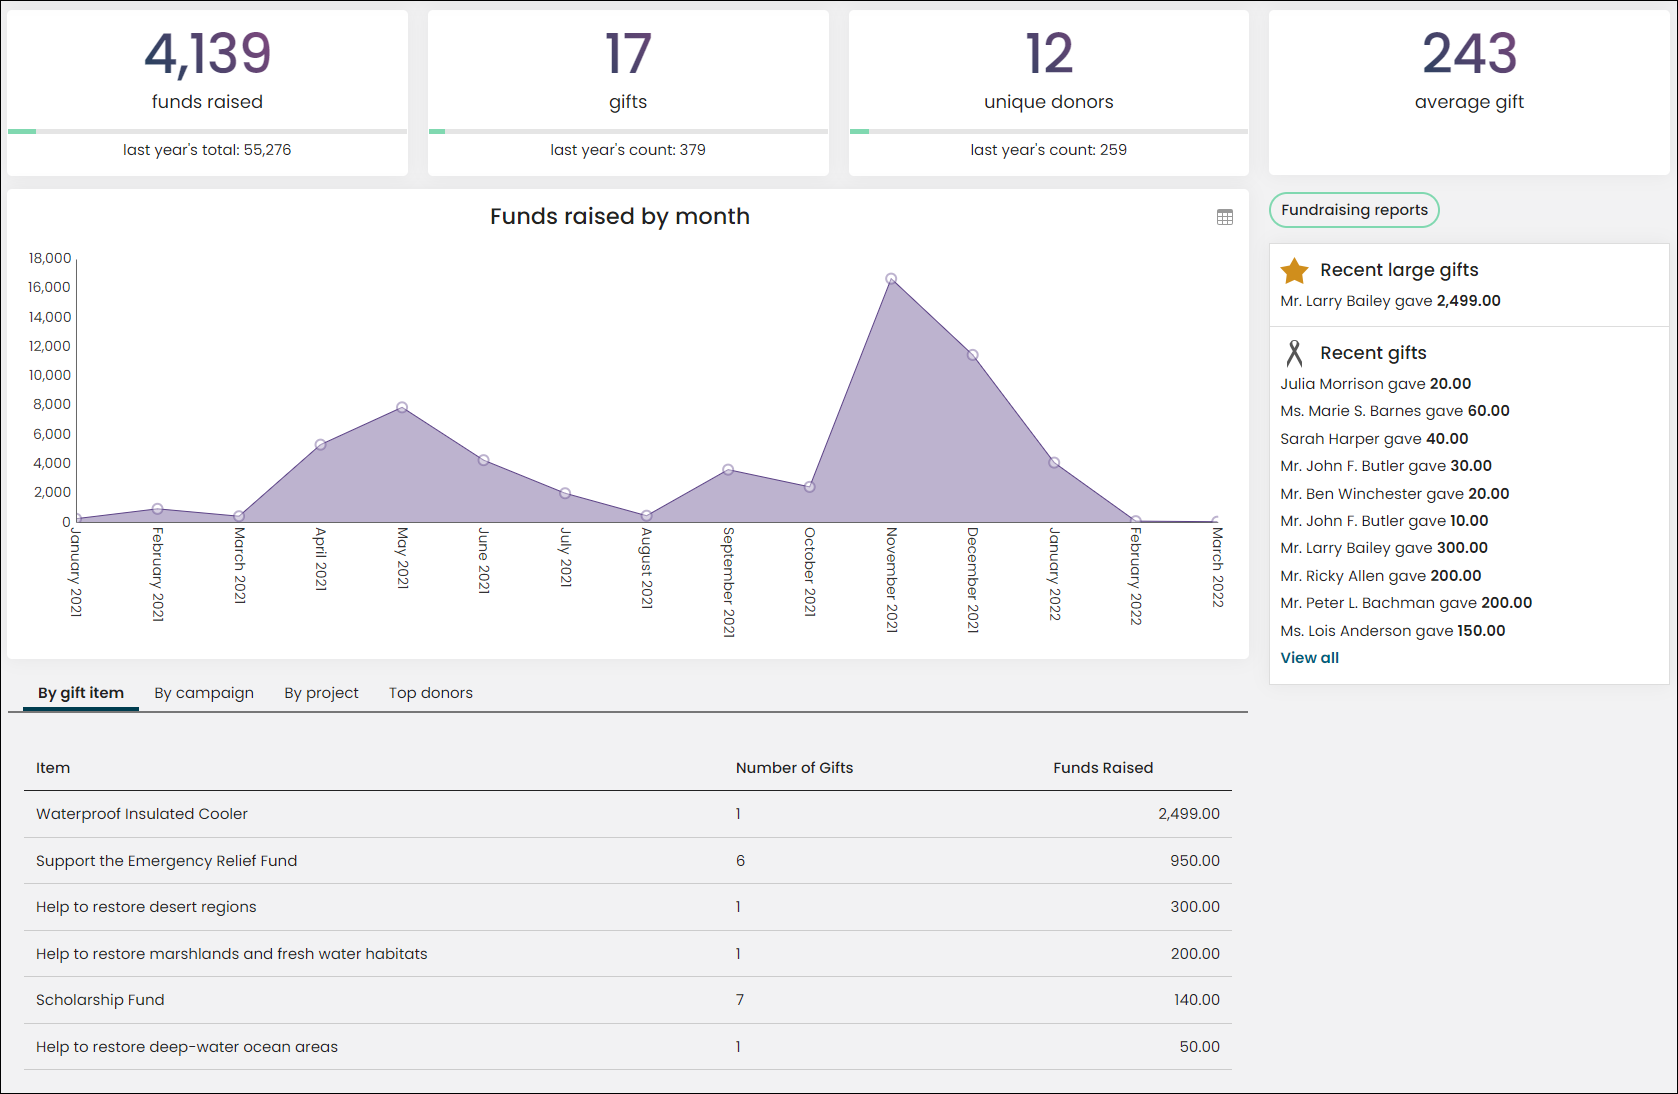
The following information can be found in the Fundraising dashboard:
- Total funds raised for the year and comparison to last year
- Total gifts for the year and comparison to last year
- Number of donors and comparison to last year
- Average gift amount
- Funds raised by month
- Amount of funds raised by gift item
- Funds raised by campaign or project
- Top Donors
- Several fundraising related alerts
Moves management dashboardPLUS
The following information can be found in the Moves management dashboard:
- The total number of major donors
- The amount of revenue generated by major donors compared with that of last year's revenue
- The average gift amount
- The number of potential donors
- Chart view of the amount of major donors in the certain stages of the cultivation process
- Chart view of the types of gifts received
- An alert for Recent Major Donor gifts showing the name of the donor, the gift amount, and the date the gift was received
- A list of all moves managers and their number of donors
- A list of all potential major donors with their work phone number, email address, and their giving amount
AutoPay Fundraising dashboardPLUS
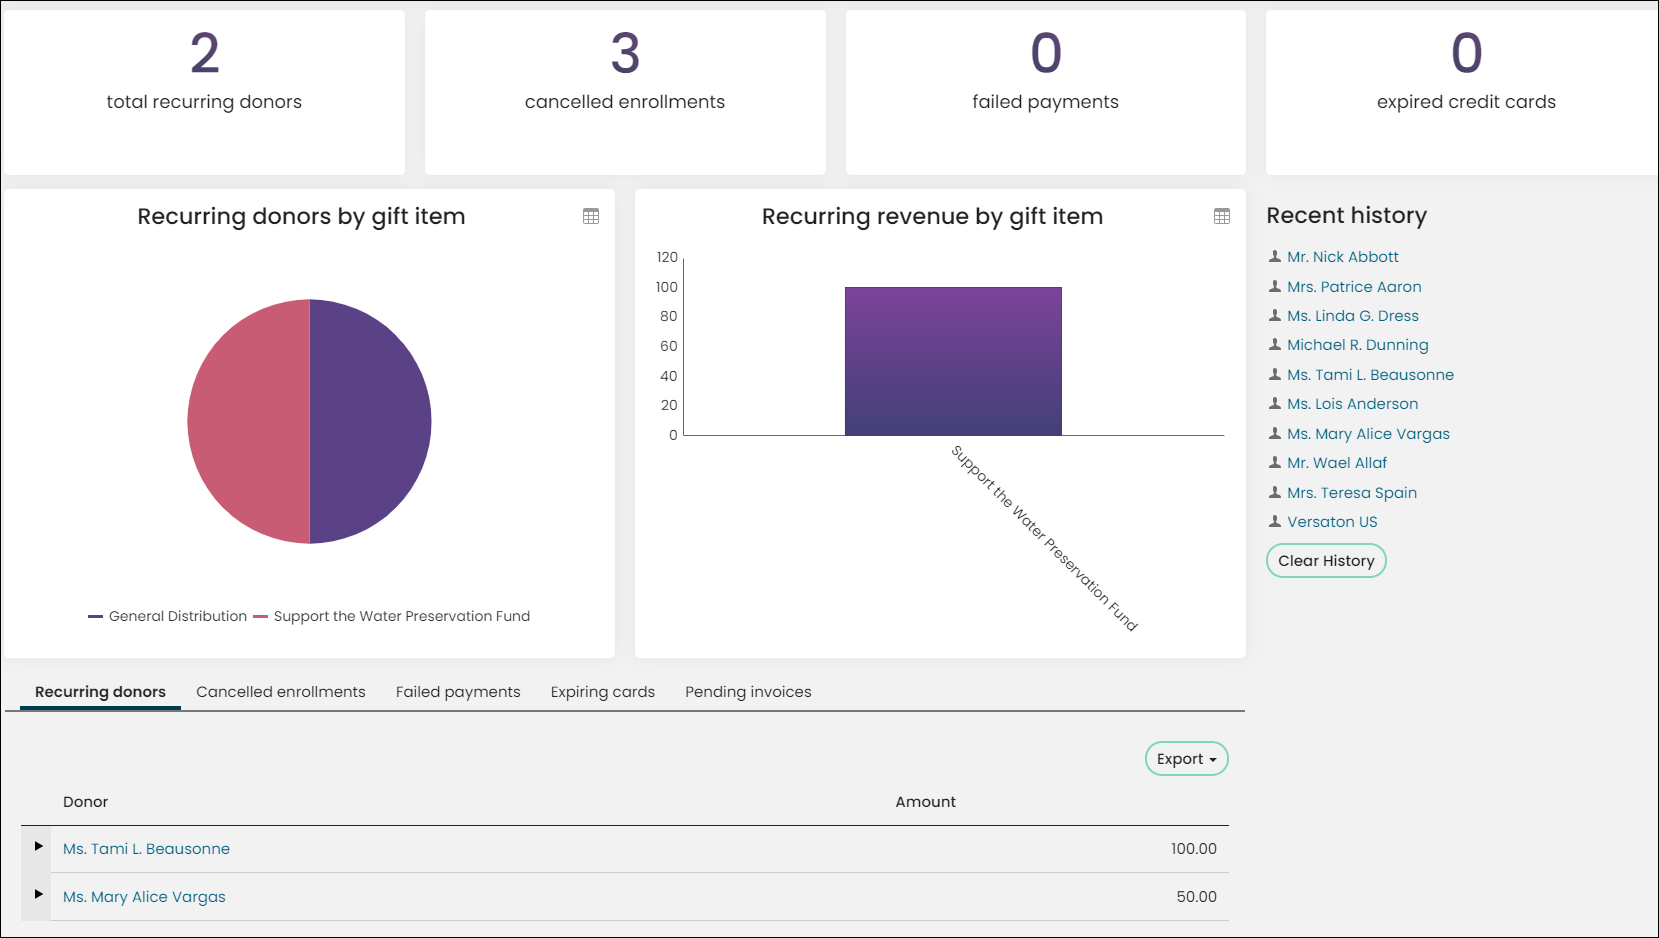
The following information can be found in the AutoPay Fundraising dashboard:
- Recurring donor (count)
- Cancelled enrollments (count)
- Failed payments (count)
- Expired credit cards (count)
- Recurring donors by gift item (pie)
- Recurring revenue by gift item (bar)
- Recurring donors with expandable detail history (table)
- Cancelled enrollments (table)
- Failed payments (table) with email
- Expiring cards (table) with email
- Pending invoices (table)
Events dashboard
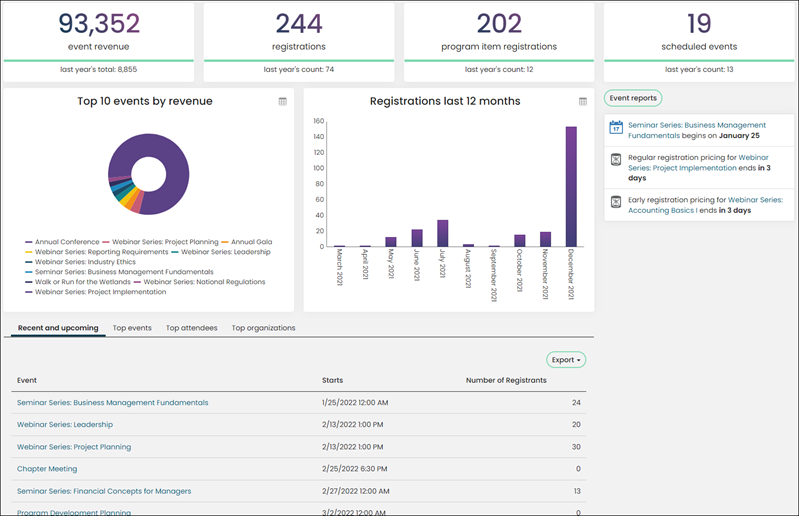
The following information can be found in the Events dashboard:
- Total event revenue for the year and comparison to last year
- Total event registrations and compared to last year
- Total function registrations for the year and comparison to last year
- Number of events and comparison to last year
- List of recent and upcoming events
- Top events by number of registrants or amount of revenue
- Top attendees ranked by registrations or revenue
- Top organizations ranked by registrations or revenue
- Several event related alerts
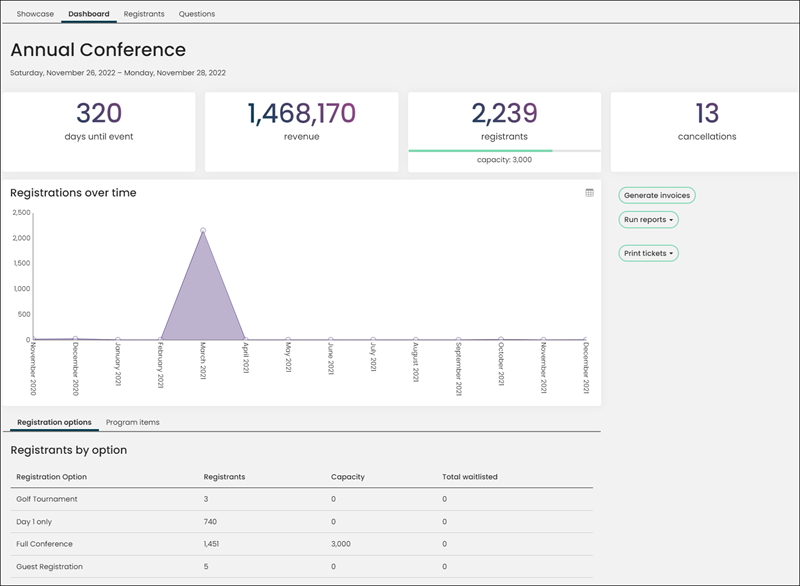
For each individual event:
- Days until event
- Revenue (from registrations)
- Registrants (registered)
- Cancellations
- Registrations over time (area chart)
- Several event reports:
- Print badges
- Registrant directory
- Registration option registrants
- Program item registrants
- Print certificates
- Planning report
- Weeks out report
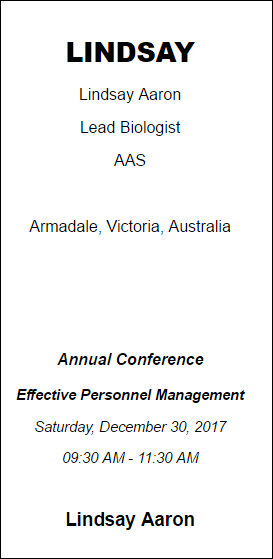
- Print ticket reports: Will only appear if Print tickets is enabled for at least one program item or registration option
- Registrants by registration option (table)
- Program item registrations (table)
- Registrations by track (pie chart)
- Registrations by category (pie chart)

Commerce dashboard
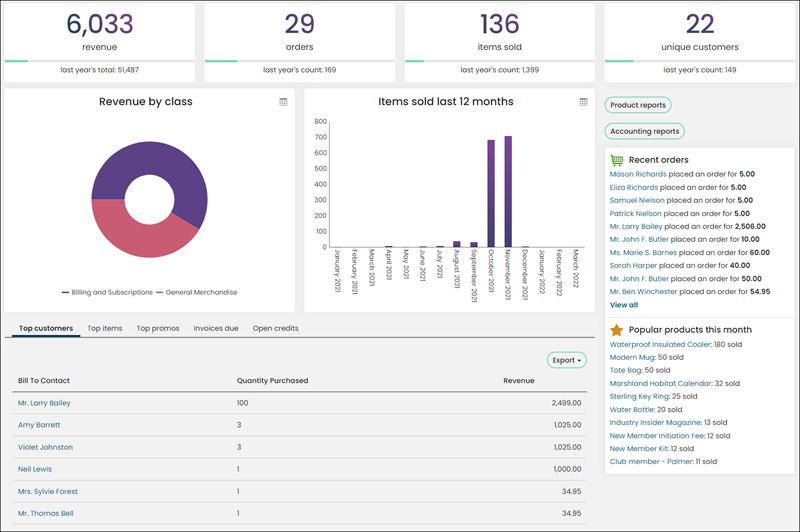
The following information can be found in the Commerce dashboard:
- Product revenue for the year and comparison to last year
- Product orders and comparison to last year
- Products sold this year and comparison to last year
- Unique customers and comparison to last year
- Amount of revenue by item class
- List of Top customers, items, and promotions
- List of Invoices due
- List of open credits
- Several commerce related alerts
Communication dashboard
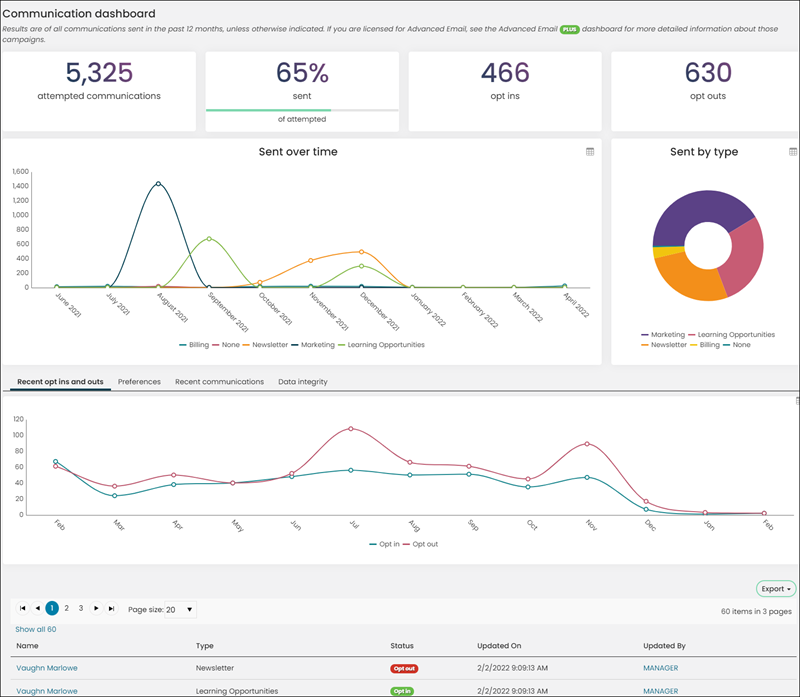
The following information can be found in the Communication dashboard:
-
Number of communication deliveries attempted
-
Percentage of communication attempts that were sent
-
Number of opt-ins
-
Number of opt-outs
-
Communications sent over time, broken down by communication type
-
Communications sent by communication type
-
Recent communications
-
Preference changes
-
Preferences by type
-
Data integrity:
- Communications sent with no deliveries
- Dropped communications
Advanced email dashboardPLUS
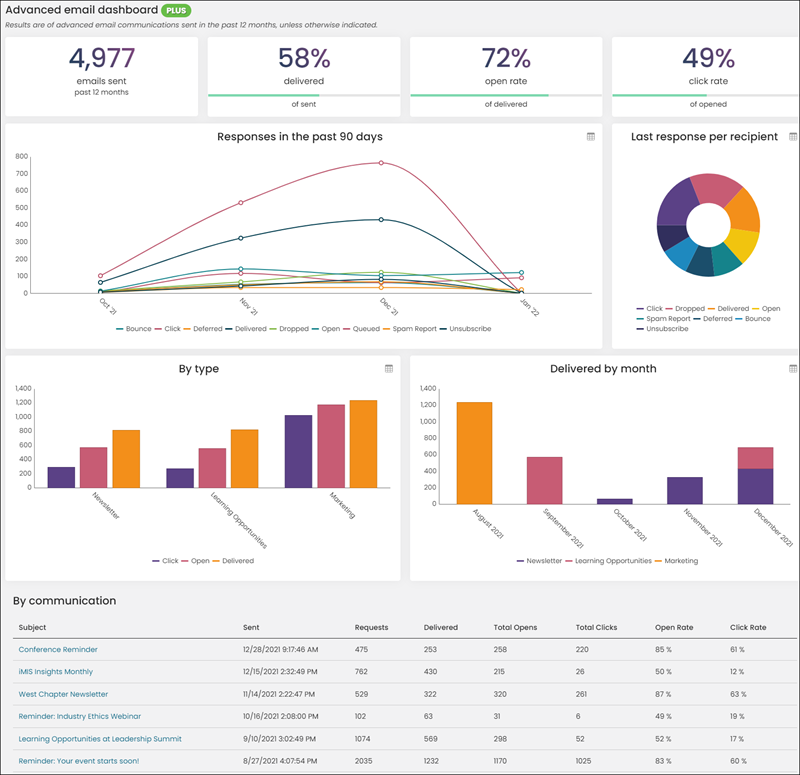
The following information can be found in the Advanced email dashboard:
- Emails sent in past 12 months
- Percent of those emails delivered
- Percent of those emails opened
- Percent of those emails where the user clicked on a link
- Type of responses and number of those responses by day for the last 30 days
- Number of the last response type from recipients (opened, bounced, and so forth)
- Number of emails by type and last response
- Number of emails by type by month
- List of each ‘communications’
RiSE dashboard
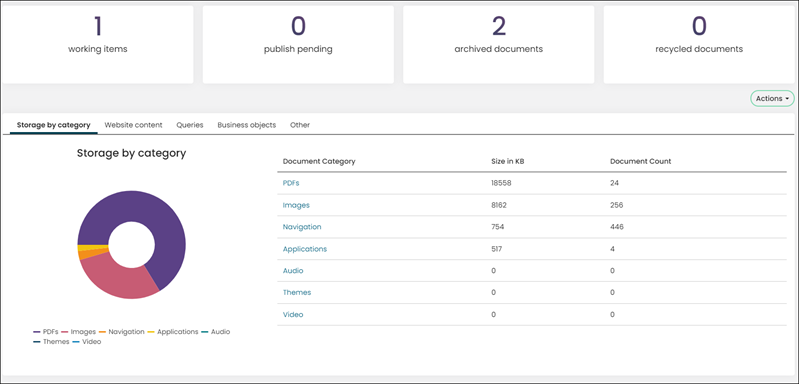
The following information can be found in the RiSE dashboard:
- Total number of working items
- Total number of website content
- Total number of business objects
- Total number of queries
- Recently published website content
- Recently published business objects
- Recently published queries
- Actions drop-down:
- Add website content
- Add business objects
- Add queries
Select the links below Publish to publish any working items.
Updated 5 months ago